A dataset for building the Einstein Discovery story contains 72 fields that are potentially relevant predictors.
Which approach is considered best practice to assess the top predictors in order to get to a meaningful and robustmodel?
A. This dataset is too big and cannot be used in Einstein Discovery. Request a new dataset with fewer predictors.
B. Build the story with all the predictors and indicate that Einstein Discovery should show the top predictors.
C. Go back to the datapreparation and reduce the number of fields to less than 30 in order to produce a story.
D. Build a story with a first set of predictors and assess which predictors are important to the story. Then drop the less important ones and add the predictors thatwere omitted in the first run and assess their impact.
An EinsteinAnalytics team wants to create a dashboard using two standard Salesforce objects. The dashboard should display data from the Case object, along with related data from the Account object. Which two processes can achieve this?
A. Extract data from the case and account objects using "sfdcDigest" transformation, Q use "append" transformation to add case data with account data, store as a dataset, and then build a dashboard using the generated dataset
B. Extract data from the case and account objects using an ETL tool, use the ETL tool to y/ Q join account and case data, and then upload the data to Einstein Analytics. Build a dashboard using the ETL generated dataset
C. Extract data from the case and account objects using "sfdcDigest" transformation, y/ Q use"augment" transformation to add case data with account data, store as a dataset, and then build a dashboard using the generated dataset
D. Extract data from the case and account objects using "dataloader", create a CSV file Q with account and case data,and then upload the CSV as a dataset to Einstein Analytics. Build a dashboard using that dataset
A customer is reviewing a story that is set to maximize the daily sales quantity of consumer products in stores and sees this chart. The visualized tooltip belongs to the blue bar for San Francisco, reflecting, November daily sales quantitiesin that city specifically.
What two conclusions can be drawn from this insight?
A. The average daily in SAN Francisco stores in November as 1601 items higher than the global average of 335.
B. November sales are higher than in other months. ThisNovember-effect is the strongest in San Francisco.
C. The average daily quantity in San Francisco stores in November was 1239 items higher than the average of all other months in San Francisco.
D. The average daily quantity in San Francisco stores in November was 1239 items higher than the average of all November sales in the country
Yasmine told Danielle she's interested in using the artificial intelligence provided by Einstein Discovery to enhance analysis Mosaic probably wouldn't have considered through their own means. How can Danielle use Einstein Analytics to load data into Einstein Discovery?
A. It's not possible. Danielle will need to log into Einstein Discovery and import the data from there.
B. Danielle needs a permission set containing the Download Analytics Data permission,then she can use the Export node to load data into Einstein Discovery.
C. Danielle needs a permission set containing the Upload External Data to Analytics permission, then she can log into Einstein Discovery and import the data from there.
D. Data loaded into Einstein Analytics as datasets can then be used in Einstein Discovery without a separate load process.
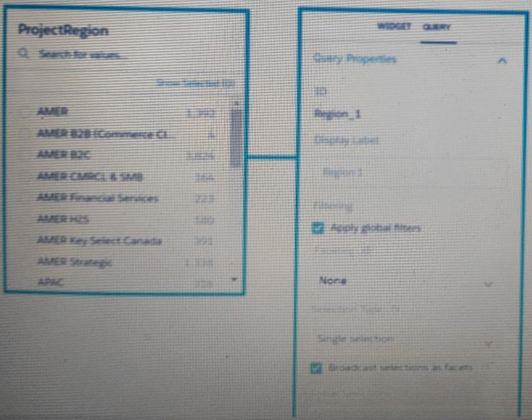
Universal Containers reports that nay selection in the List widget is not affecting the pie chart in one of their tableau CRM dashboard. They query options associated with the List widget andPie chart are shown in the graphic Which change can a Tableau CRM Consultant implement to solve this issues, given that the queries are using the same dataset?
A. Set faceting to All instead of None in the query “Step_pie_1.”
B. Use result binding/interaction in the filters section of the query “Step_pie_1.”
C. Set faceting to all instead of None in the query “Region_1.”
D. Use selection binding/interaction in the filters section of the query “Region_1.”
What are the two types of bindings? Choose 2:
A. Results binding
B. Data bindings
C. Descriptionbindings
D. Selections bindings
Trending data limits: Maximum number of trended datasets per user and rows per snapshot:
A. 5 per user, 200,000 per snapshot
B. 10 per user, 100,000 per snapshot
C. 10 per user, 200,000 per snapshot
D. 5 per user, 100,000 per snapshot
Your sales team requests that datasets for their dashboards are refreshed every hour. You agree to investigate if this is possible and find that the dashboards use A datasets created from two recipes. The first recipe takes 43 min to run and the second recipe takes 25 min to run.
Is it possible to refresh data every hour?
A. Yes, the number of recipe runs doesnot exceed the limit of 60 in a 24 hour rolling period.
B. No, the number of recipe runs exceed the limit of 40 in a 24 hour rolling period.
C. No, the total duration of the recipe jobs exceeds one hour.
D. Yes, with the concurrent recipe runs theduration is less than hour.
An Einstein Consultant is implementing encryption for a customer.
Which two statements about Einstein Analytics Encryption are true? Choose 2 answers
A. When Einstein Analytics Encryption is enabled, all newly registered datasets are encrypted at rest.
B. By default, the same keys are used to encrypt data in Einstein Analytics as are used to encrypt data in Salesforce objects.
C. The customer's org must have a Shield Platform Encryption tenant secret.
D. Bring Your Own Key is not supported.
A Tableau CRM consultant decides to use a recipe to create a new dataset. Which two source types can be used for the recipe?
Choose 2 answers
A. Existing datasets
B. Records from a Salesforce object
C. Datasetlens
D. Connected data(Synced)
| Page 11 out of 25 Pages |
| Tableau-CRM-and-Einstein-Discovery-Consultant Practice Test Home | Previous |
Copyright © - All Rights Reserved