After uploading a standard file into Marketing Cloud intelligence via total Connect, you noticed that the number of rows uploaded (to the specific data stream) is NOT equal to the number of rows present in the source file. What are two resource that may cause this gap?
A. All mapped Measurements for a given row have values equal to zero
B. Main entity is not mapped
C. The source file does not contain the mediaBuy entity
D. The file does not contain any measurements (dimension only)
Explanation: In Marketing Cloud Intelligence, discrepancies between the number of rows uploaded and the number of rows present in the source file can be caused by several factors. If all mapped measurements for a row are zero, that row may be excluded from the upload, as it does not contribute to the analytics. Additionally, if the main entity, which acts as the primary identifier for records, is not mapped, the system cannot correctly ingest the data as it lacks the necessary reference to organize and store the information.
A client Ingested the following We into Marketing Cloud Intelligence:
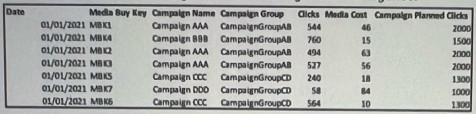
The mapping of the above file can be seen below:
Date — Day
Media Buy Key — Media Buy Key
Campaign Name — Campaign Name
Campaign Group -. Campaign Custom Attribute 01
Clicks —> Clicks
Media Cost —> Media Cost
Campaign Planned Clicks —> Delivery Custom Metric 01
The client would like to have a "Campaign Planned Clicks" measurement.
This measurement should return the "Campaign Planned Clicks" value per Campaign, for
example:
For Campaign Name 'Campaign AAA", the "Campaign Planned Clicks" should be 2000, rather than 6000 (the total sum by the number of Media Buy keys).
In order to create this measurement, the client considered multiple approaches. Please review the different approaches and answer the following question:
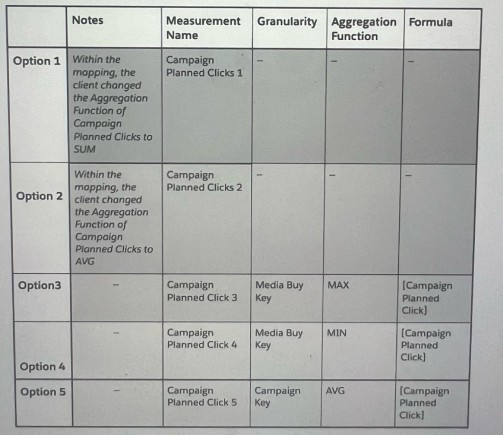
Which two options will yield a false result:
A. Option 2
B. Option 5
C. Option 3
D. Option 4
E. Option 1
Explanation: The goal is to obtain a "Campaign Planned Clicks" value per Campaign, not accumulated by Media Buy keys. Option 1 (SUM aggregation function) would sum all the "Campaign Planned Clicks" across Media Buy keys which would not yield the unique value per Campaign. Similarly, Option 5 (AVG aggregation function at Campaign Key level) would incorrectly average the values. Both options do not provide a way to return a singular "Campaign Planned Clicks" value for each Campaign.
Your client would like to create a new harmonization field - Exam Topic. The below table represents the harmonization logic from each source.
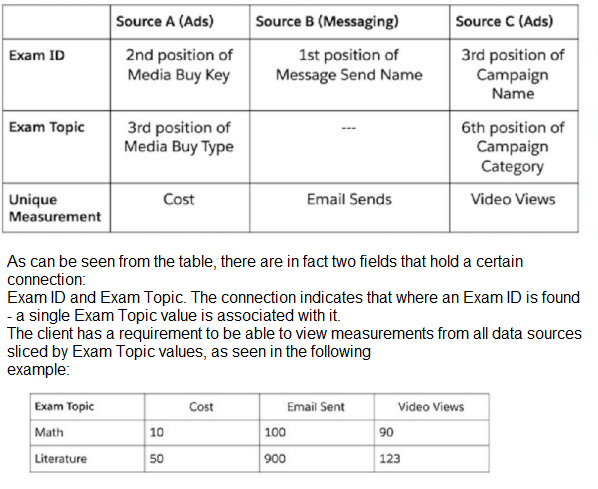
The client suggested to create, without any mapping manipulations, several patterns via the harmonization center that will generate two Harmonized Dimensions:
Exam ID
Exam Topic
Given the above information, which statement is correct regarding the ability to implement this request with the above suggestion?
A. The above Patterns setup will not work for this use case.
B. The solution will work - the client will be able to view Exam Topic with Email Sends.
C. Only if 5 different Patterns are created, from 5 different fields - the solution will work.
D. The Harmonized field for Exam ID is redundant. One Harmonized dimension for Exam Topic is enough for a sustainable and working solution
Explanation: If the harmonization logic consistently associates a single Exam Topic with each Exam ID across all data sources, then creating two harmonized dimensions may be unnecessary. One harmonized dimension for Exam Topic would suffice because it inherently carries the Exam ID's uniqueness within it. The harmonized dimension for Exam Topic would allow the client to slice the data by Exam Topic values, fulfilling the requirement.
A technical architect is provided with the logic and Opportunity file shown below:
The opportunity status logic is as follows:
For the opportunity stages “Interest”, “Confirmed Interest” and “Registered”, the status should be “Open”.
For the opportunity stage “Closed”, the opportunity status should be closed Otherwise, return null for the opportunity status
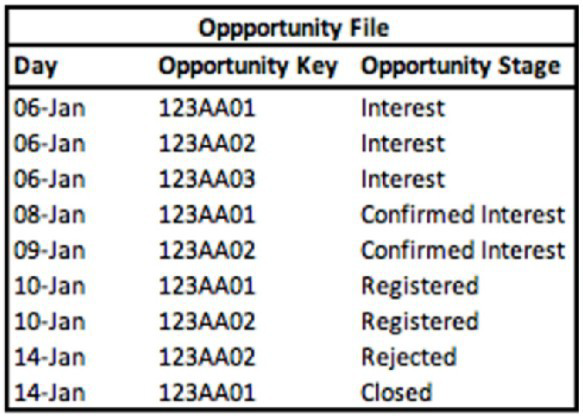
Given the above file and logic and assuming that the file is mapped in a GENERIC data stream type with the following mapping:
“Day” — Standard “Day” field
“Opportunity Key” > Main Generic Entity Key
“Opportunity Stage” — Generic Entity Key 2
“Opportunity Count” — Generic Custom Metric
A pivot table was created to present the count of opportunities in each stage. The pivot table is filtered on January (entire month). What is the number of opportunities in the Interest stage?
A. 1
B. 3
C. 2
D. 0
Explanation: Based on the Opportunity file, the Opportunity Stage of 'Interest' occurs 3 times across unique Opportunity Keys. Since the pivot table is filtered to present the entire month of January and the Opportunity Stage 'Interest' is listed three times with different Opportunity Keys, the count of opportunities in the 'Interest' stage would be 3.
What are two potential reasons for performance issues (when loading a dashboard) when using the CRM data stream type?
A. When a data stream type ''CRM - Leads' is created, another complementary 'CRM - Opportunity' is created automatically.
B. Pacing - daily rows are being created for every lead and opportunity keys
C. No mappable measurements - all measurements are calculated
D. The data is stored at the workspace level.
Explanation: For performance issues when loading a dashboard using CRM data stream
type:
Pacing can create performance issues because daily rows for every lead and opportunity key can result in a very large number of rows, increasing load times. Having only calculated measurements means there are no direct, mappable values to query against, which can increase the computational load and affect performance.
A client has provided you with sample files of their data from the following data sources:
1.Google Analytics
2.Salesforce Marketing Cloud
The link between these sources is on the following two fields:
Message Send Key
A portion of: web_site_source_key
Below is the logic the client would like to have implemented in Datorama:
For ‘web site medium’ values containing the word “email” (in all of its forms), the section after the “_” delimiter in ‘web_site_source_key’ is a 4 digit number, which matches the 'Message Send Key’ values from the Salesforce Marketing Cloud file. Possible examples of this can be seen in the following table:
Google Analytics:
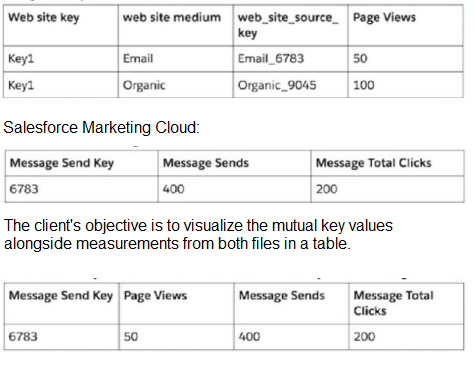
In order to achieve this, what steps should be taken?
A. Within both files, map the desired value to Custom Classification Key as follows Salesforce Marketing Cloud: map entire Message Key to Custom Classification Key. Google Analytics: map the extraction logic to Custom Classification Key.
B. Create a Web Analytics Site custom attribute and populate it with the extraction logic. Create a Data Fusion between the newly created attribute and the Message Send Key.
C. Upload the two files and create a Parent-Child relationship between them. The Override Media Buy Hierarchy checkbox is checked in Google Analytics.
D. Create a Web Analytics Site Source custom attribute and populate it with the extraction logic. Create a Data Fusion between the newly created attribute and the Message Send Key.
Explanation: To create a linkage between Google Analytics and Salesforce Marketing Cloud data based on the "Message Send Key" and a portion of the "web_site_source_key," both values need to be harmonized into a common key. This is done by mapping the full Message Send Key from Salesforce Marketing Cloud and the extracted part of the web_site_source_key from Google Analytics to the same Custom Classification Key. This mapping will create a common identifier that can be used to combine the data from both sources for analysis and visualization.
An implementation engineer has been asked to perform a QA for a newly created harmonization field, Color, implemented by a client.
The source file that was ingested can be seen below:
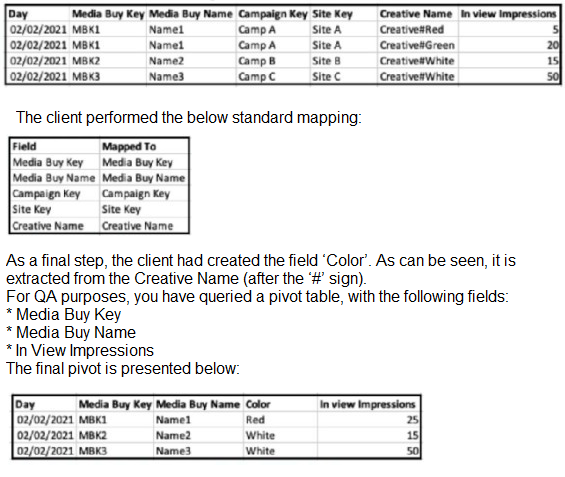
A. A Harmonized dimension was created via a pattern over the Creative Name.
B. A calculated dimension was created with the formula: EXTRACT([Creative_Namel, #1)
C. An EXTRACT formula (for Color) was written and mapped to a Media Buy custom attribute.
D. An EXTRACT formula (for Color) was written and mapped to a Creative custom attribute.
Explanation: Given that the 'Color' field is extracted from the 'Creative Name' field and appears to be part of the creative-level data, the most logical method would be to create an EXTRACT formula and map it to a Creative custom attribute. This allows the 'Color' value to be associated directly with each creative entry. In Salesforce Marketing Cloud Intelligence, the EXTRACT formula can be used to parse and segment text strings within a field, and this process is used for harmonizing data by creating new dimensions or attributes based on existing data, which is what's described here. This answer is consistent with Salesforce Marketing Cloud Intelligence features that enable data transformation and harmonization through formulaic mapping, as per the official Salesforce documentation on data harmonization and transformation.
Your client provided the following sources:
Source 1:
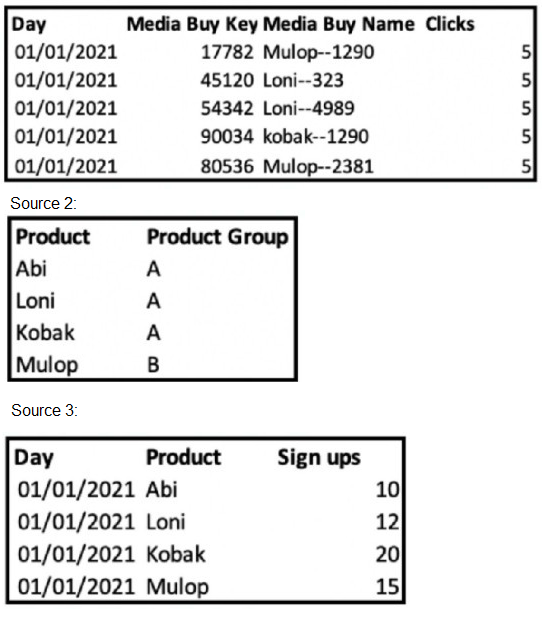
As can be seen, the Product values present in sources 2 and 3 are similar and can be linked with the first extraction from ‘Media Buy Name’ in source1
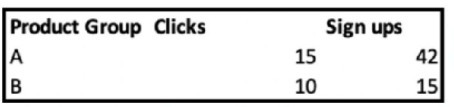
The end goal is to achieve a final view of Product Group alongside Clicks and Sign Ups, as described below:
Which two options will meet the client’s requirement and enable the desired view?
A. Custom Classification: 1
Source 1: Custom Classification key will be populated with the extraction of the Media Buy Name.
Source 2: ‘Product’ will be mapped to Custom Classification key and ‘Product Group’ to a Custom Classification level. Exam Timer
Source 3: ‘Product will be mapped to Custom Classification key. Came
B. Overarching Entities:
Source 1: custom classification key will be populated with the extraction of the Media Buy Name.
Source 2: ‘Product’ will be mapped to Product field and ‘Product Group’ to Product Name.
Source 3: ‘Product’ will be mapped to Product field.
C. Parent Child:
All sources will be uploaded to the same data stream type - Ads. The setup is the following:
Source 1: Media Buy Key —- Media Buy Key, extracted product value — Media Buy Attribute.
Source 2: Product — Media Buy Key, Product Group —- Media Buy Attribute.
Source 3: Product — Media Buy Key.
D. Harmonization Center:
Patterns from sources 1 and 3 generate harmonized dimension ‘Product’. Data Classification rule, using source 2, is applied on top of the harmonized dimension
Explanation: To achieve a final view of Product Group alongside Clicks and Sign Ups, we
should use:
Option A:
Custom Classification: By using a Custom Classification key populated with the extraction of the Media Buy Name in Source 1, we can then map 'Product' in Source 2 to this key and 'Product Group' to a Custom Classification level. This will allow for grouping and analysis by Product Group, as well as enable the desired view to be created.
Option D:
Harmonization Center: With patterns from Sources 1 and 3, we can create a harmonized dimension 'Product'. Then, by applying a Data Classification rule using Source 2, we can enhance the harmonized dimension. This allows us to align 'Product Group' with the 'Product' from Sources 1 and 3, facilitating an integrated view of Clicks and Sign Ups by Product Group.
A client created a new KPI: CPS (Cost per Sign-up).
The new KIP is mapped within the data stream mapping, and is populated with the following logic: (Media Cost) / Sign-ups)
As can be seen in the table below, CPS was created twice and was set with two different aggregations:
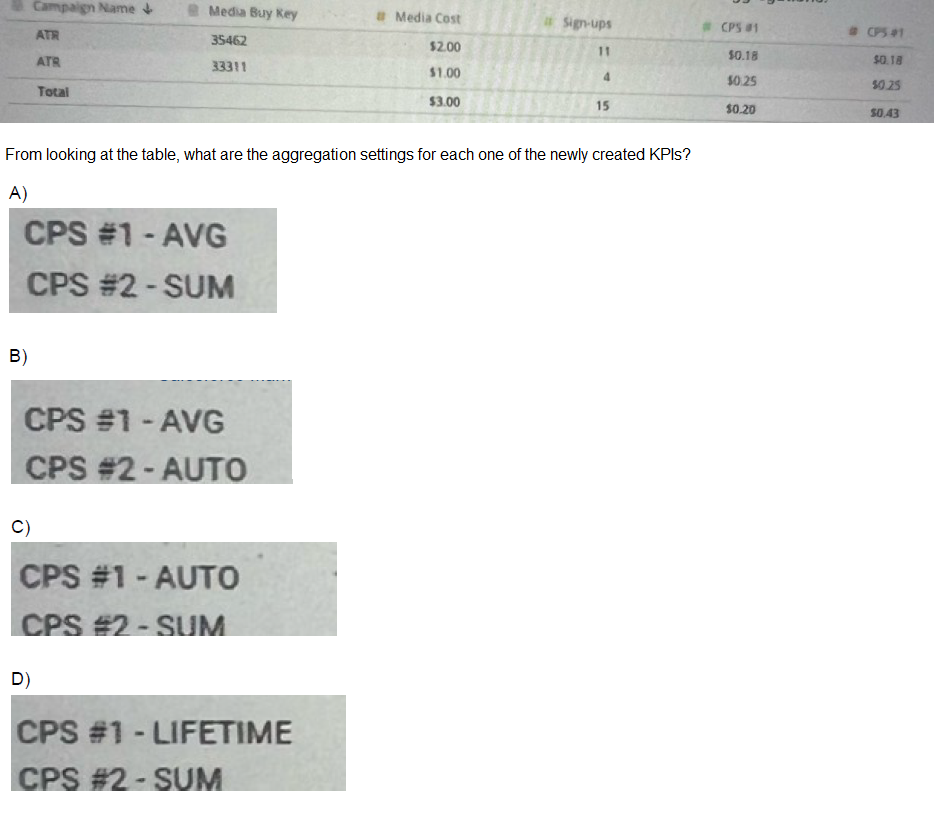
A. Option A
B. Option B
C. Option C
D. Option D
Explanation: The KPI CPS (Cost per Sign-up) would be calculated by dividing the 'Media Cost' by 'Sign-ups'. The table indicates that CPS is set with two different aggregations. In option C, CPS #1 is set to 'AUTO', which allows the system to decide the best aggregation method based on the context. CPS #2 is set to 'SUM', which indicates that the individual costs per sign-up are summed up across multiple records to provide a total cost per signup.
A technical architect is provided with the logic and Opportunity file shown below: The opportunity status logic is as follows:
For the opportunity stages “Interest”, “Confirmed Interest” and “Registered”, the status should be “Open”.
For the opportunity stage “Closed”, the opportunity status should be closed.
Otherwise, return null for the opportunity status.
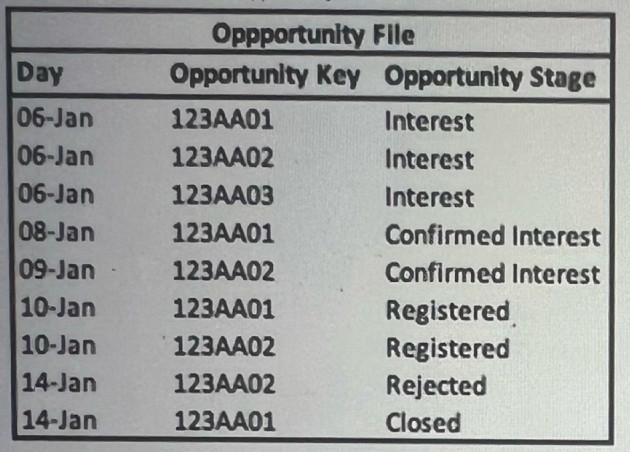
Given the above file and logic and assuming that the file is mapped in a GENERIC data stream type with the following mapping:
“Day” — Standard “Day” field
“Opportunity Key” >
Main Generic Entity Key “Opportunity Stage” — Generic Entity key 2
A pivot table was created to present the count of opportunities in each stage. The pivot table is filtered on Jan 7th-11th.Which option reflects the stage(s) the opportunity key 123AA01 is associated with?
A. Interest & Registered
B. Confirmed interest
C. interest
D. Confirmed Interest & Registered
Explanation: Filtering the pivot table on January 7th-11th, we see that the Opportunity Key 123AA01 appears on January 6th with the stage 'Interest' and then on January 10th with the stage 'Registered'. Even though the 'Interest' stage is not within the filtered dates, it is the initial stage of the opportunity, so it should be counted along with the 'Registered' stage which falls within the filter range.
| Page 2 out of 7 Pages |
| Marketing-Cloud-Intelligence Practice Test Home |
Copyright © - All Rights Reserved